So if you want to get started with A/B testing, you should calculate up front if you have enough users and conversions to see if it is even possible to perform an A/B test on your site. There are some general rules of thumb out there that say “don’t go A/B testing when you have < 1000 conversions”, which is fine, but probably not really helpful in your situation.
Direct link to the Google Sheets Template Preview.
It really depends on a lot of variables to know if you can run a specific test on your site (7 to be exact). For simple, one-off calculations you can use Evan Millers website (http://www.evanmiller.org/ab-testing/sample-size.html) and it’ll quickly tell you the sample size for your website:
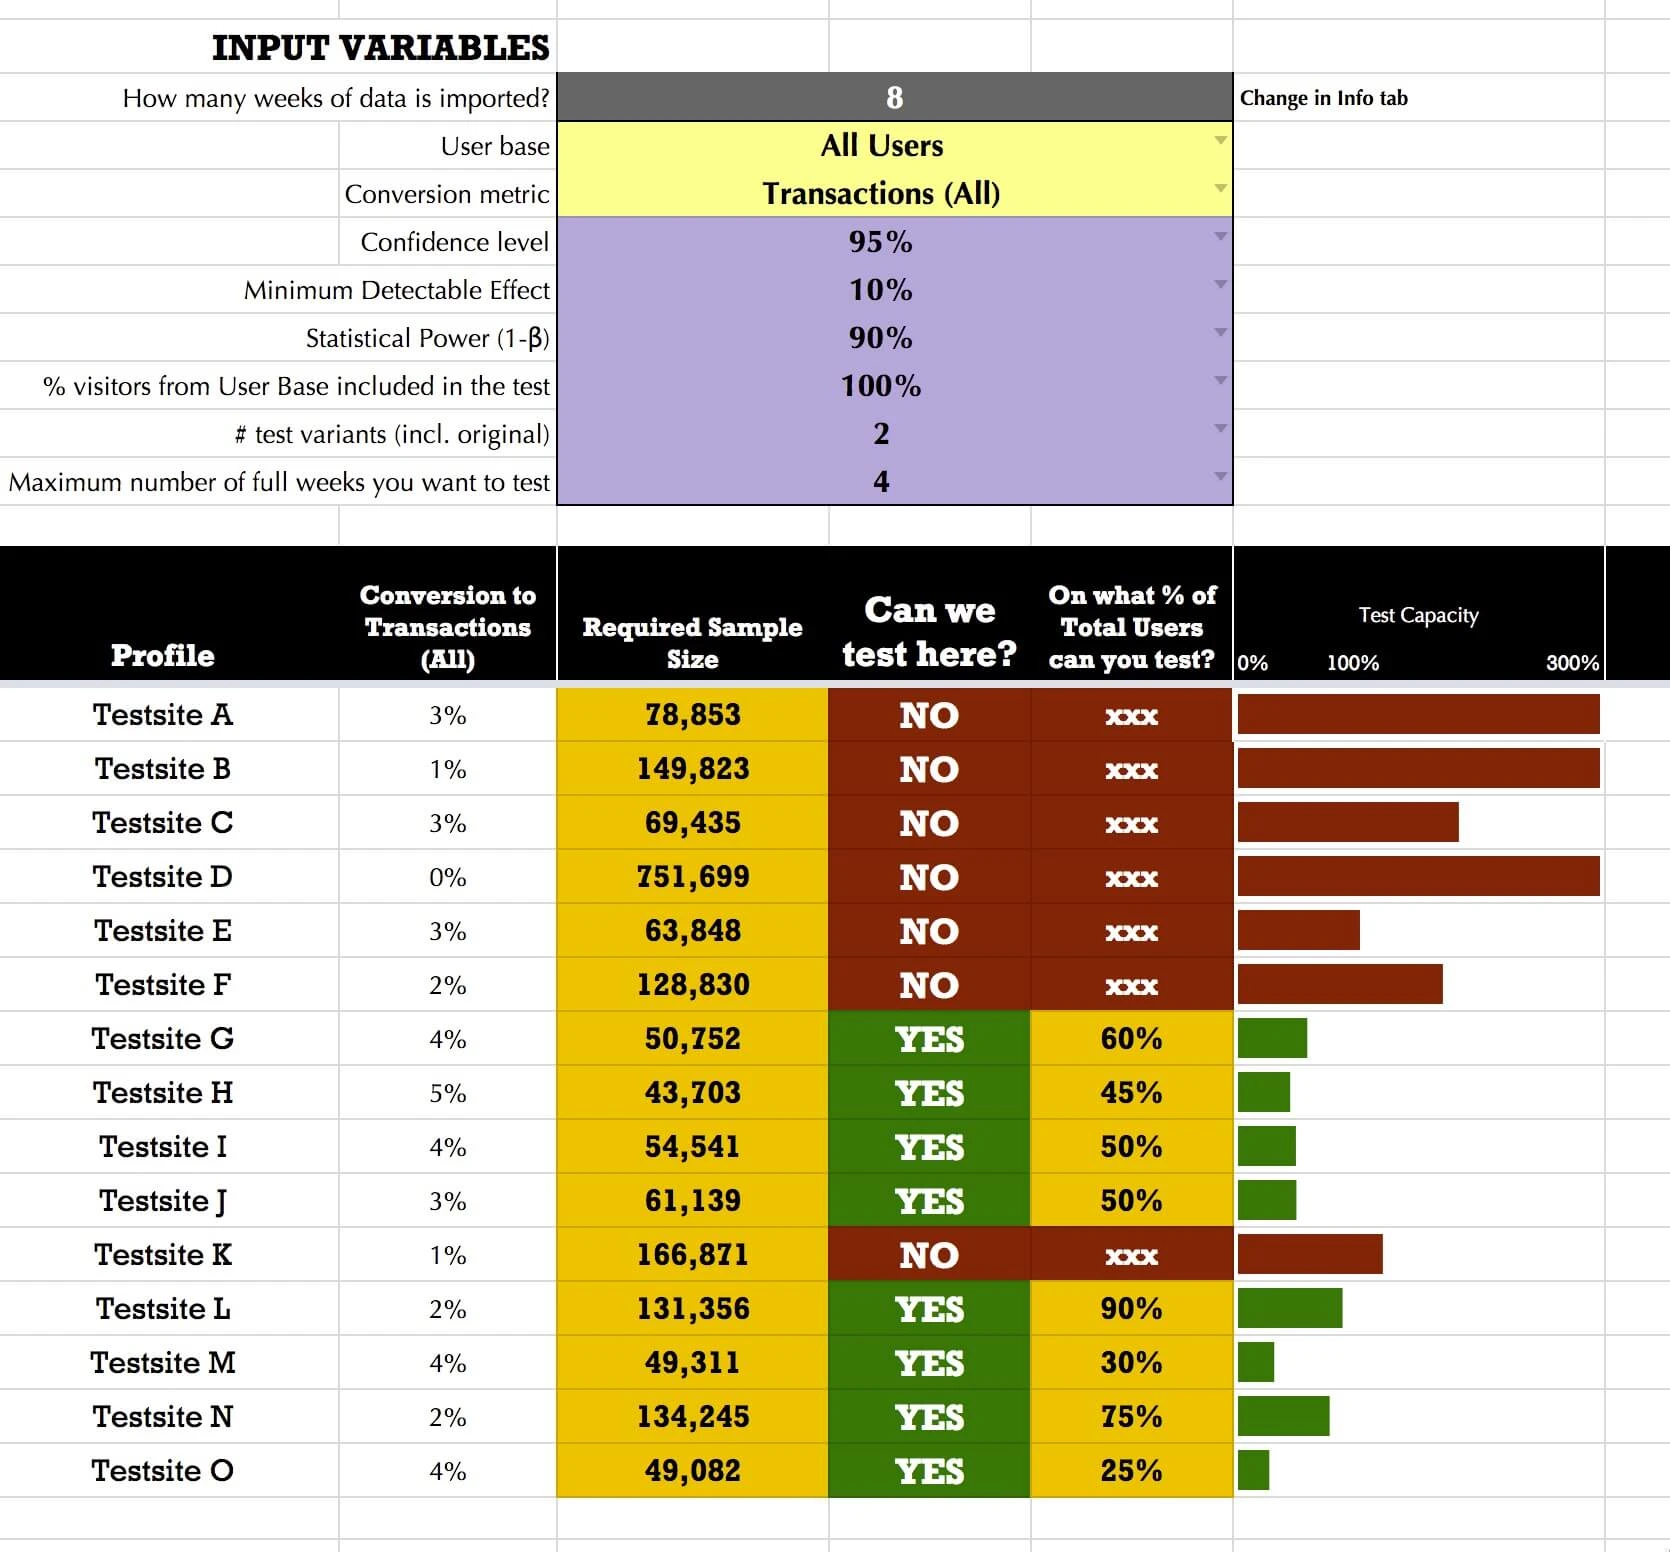
If your baseline is 5% conversion, you want to detect a 10% relative change, have 90% power with a 5% significance level, you need over 40K users to hit each variation in your test. If you know the number of variants you want to test, the duration of the test and lookup the number of users you have in that period of time you know if it’s feasible to even run the test. This is a great tool to do a couple of calculations, but what if you have multiple websites and maybe multiple segments within those websites? What if you want to know to check the testability not only for transaction, but also for other (micro)conversions. And numbers change over time so you might want to recalculate or do a separate calculation for peak season That is A LOT of manual calculations. I’m way too lazy for that. So I spend many hours over the last days couple of days (yes, irony…) building a spreadsheet that does this automatically. And I created a Google Sheets Template out of it to share with you so you can use it too! Overview of the testability of your websites:
Detailed view of the numbers of one website:
Go to the Google Sheets Template Preview. It’s as simple as entering the data (use Supermetrics to automate that too), selecting the variables and poof you know for all websites or segments if you can run a reliable test there! There is a detailed instruction in the first tab of the sheet. I also created an explainer video to take you through the different settings. Let me know if you have any questions/remarks!
